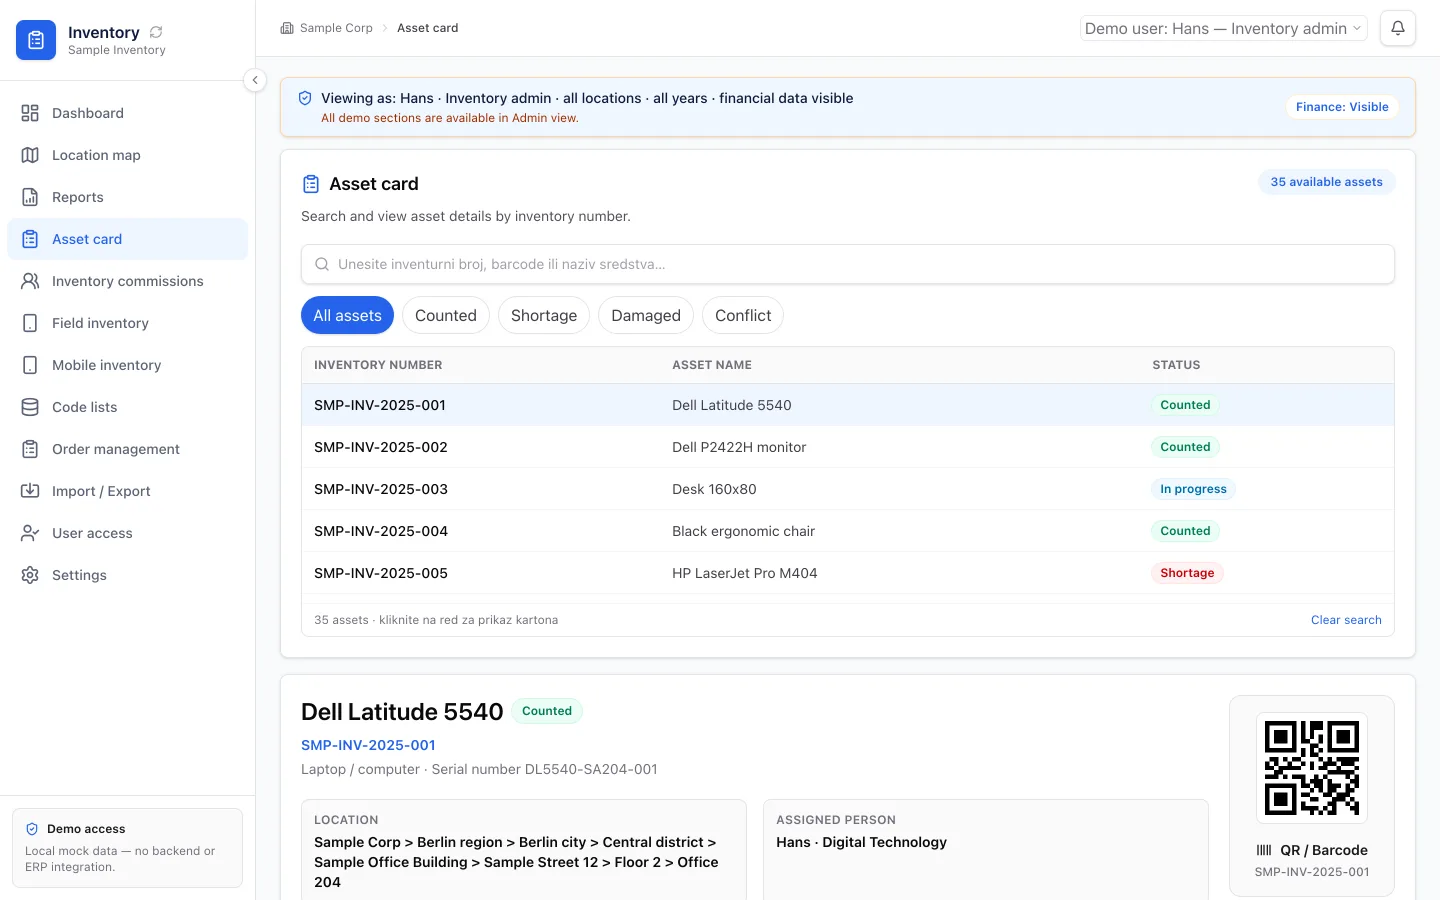
A dashboard saves effort when it replaces a specific search for information. A page of charts can still require a meeting to explain what needs attention.
Name the decision
Identify what the manager must decide: reassign work, resolve an exception or review a delay. Choose information that changes that decision, rather than including every available measure.
For a queue review, the useful view may be open items grouped by age and responsible role. A total count alone does not show which item needs action.
Make the next step accessible
Link a summary to the relevant records with appropriate access. Show when the data was last updated and whether the source is complete. A stale view should not look like a current measurement.
Test the dashboard with a known case. Ask the manager to find the case, explain why it appears and identify the next action without assistance.
Measure the task, not the number of charts
Compare the effort required to prepare the same decision before and after the view exists. Do not claim savings based solely on reducing page clicks.
If the figures require reconciliation first, resolve the reporting definitions before adding more visualisations.